
Under Pressure Rating©
In tennis - like in many sports - the ability to handle pressure is a key factor. At atptour.com they have created the Under Pressure Rating© to express how well tennis players can handle pressure. This rating is defined as the sum of the percentages of Break Points Converted, Break Points Saved, Tie Breaks Won and Deciding Set Won. Currently Novak Djokovic is the all time leader of this rating. He has a score of 247.8 which is the sum of the percentages for each of the four measures: 44.4% + 65.4% + 64.5% + 73.5%.
To me - speaking as a Backhand Developer - this way of calculating seems a bit arbitrary. Of course each of those four measures captures the ability to handle pressure to some extend. But why should you just add them? Do they equally well represent the ability to handle pressure? Besides, each measure is most likely a mix of several factors. For example Deciding Set Won tells something about the ability to handle pressure, but it may very well be an indicator of stamina / physical endurance as well.
In this article I will show how we can use a technique from Machine Learning called Independent Component Analysis to try to improve the measure. We will also see how "hidden" dimensions can be revealed from the original data.
Some observations on current rating
To show that the Under Pressure Rating© might have some slight deficiencies we point out the following observations:
- Kei Nishikori is ranked 5th on all time ranking. This seems a bit too high, taking into account he has never won a grand slam.
- Andre Agassi is ranked 14th on all time ranking. This seems a bit too low, taking into account he was one of the few who completed the career slam
- Robin Söderling is ranked 97th on all time ranking. This seems a bit too low, taking into account he was the only player in history who was able to beat Nadal on Roland Garros
- John Isner is ranked higher than legends Jim Courier, John McEnroe, Ivan Lendl and Michael Chang on all time ranking.
- Three japanese in top 10 of 2018 - what happened here?
- Novak Djokovic is ranked fifth in 2019 behind Roger Federer, while he was able to withstand extremely high pressure during the epic Wimbledon Final 2019 and became number 1 again during that year.
How we will approach the problem: Demixing Data
We assume that the measures we take into account are "mixed signals". So for example the measure Deciding Set Won is composed of mix of several underlying factors, among which is the ability to handle pressure. What we will try to do is "demix" the data to reveal the underlying factors.
For this we will use Independent Component Analysis (ICA). ICA works very well for demixing audio signals. Suppose there are two people speaking at the same time and suppose there are two microphones. Each microphone records a combination of the voices. By applying ICA to these signals you can "reconstruct" the original two voices as separate signals.
For our case we have four "recorded signals":
- Percentage of Break Points Converted (BPC)
- Percentage of Break Points Saved (BPS)
- Percentage of Tie Breaks Won (TBW)
- Percentage of Deciding Set Won (DSW)
From these signals we try to derive the "sources", among we assume there is at least the ability to handle pressure. We assume there are other sources as well, but we don't define them yet. And, important as well: we assume that the ability to handle pressure has a positive effect on each of the four signals. This is important, since after we apply ICA, we need to figure out somehow which of the demixed source signals corresponds to the ability to handle pressure.
We used Python Scikit's FastICA for our experiment. The hyperparameter n_components is most important - it sets the amount of sources you want to derive from your data. In this case n_components=4 turned out to work best and gave the most consistent results. After supplying your training data you get a transformation matrix which we can use for the new measure we want to create. From the matrix we picked the dimension which either only had positive or only negative scalars. We did this 1000 times and averages the resulting vector. Eventually we got these weights:
Backhand Developer Pressure Rating™ =0.45 × BPC +0.38 × BPS +0.09 × TBW +0.09 × DSW
These weights suggest that Break Points Converted and Break Points Saved are most important in determining ones ability to handle pressure. The other two measures Tie Breaks Won and Deciding Set Won seem to be less important.
New Rating
Below you see the new ranking if you apply the new measure. The column 'Move' is used to compare the old with the new ranking.
Some observations on new rating
Compared to the observations of the old rating (see section above) we can see that all weird ratings have changed to more "reasonable" ratings:
- Kei Nishikori has dropped from 5th to 14th on all time ranking.
- Andre Agassi moved up from 14th to 7th on all time ranking.
- Robin Söderling moved up from 97th to 30th
- John Isner is now ranked lower than the legends John McEnroe, Ivan Lendl and Michael Chang except for Jim Courier.
- Only Kei is in the top 10 of 2018
- Novak Djokovic is ranked third in 2019 before Roger Federer.
Other Source Signals
As we mentioned in the section about demixing data there might be other 'source signals' present in the data as well besides the ability to handle pressure. From the four sources we demixed, we picked one of them as the source 'ability to handle pressure'. But what about the other three? Do they respresent some tennis quality as well or are they random 'by-products'?
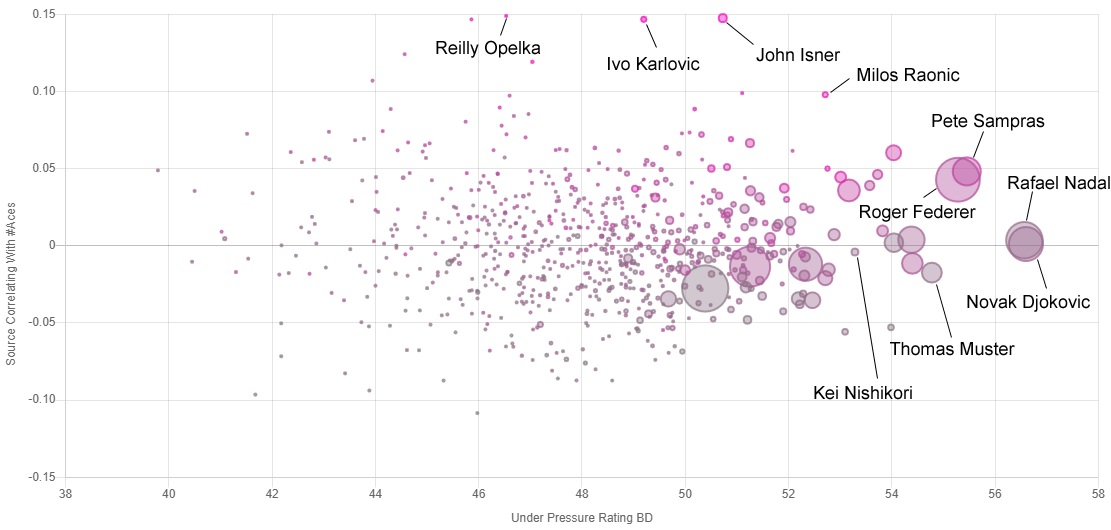
At least from one of the three dimensions we can say that it represents a tennis quality, namely the ability to serve well. When we sorted the data based on this dimension we saw that John Isner, Ivo Karlovic and Reilly Opelka were the leaders. As we know, these players are known for their height (they are all 2 meters +). The fact that they can serve extremely well is probably not because they can handle pressure well, but more likely because they are very tall. And if players can serve well they are more likely to have a high percentage of Break Points Saved. This explains why John Isner was high ranked on the ATP pressure ranking.
Below you can see a bubble chart in which this 'serve dimension' is put on the Y axis. The new pressure rating is put in the X axis. The color respresents the average aces per match (purple is a lot of aces, grey is few aces). The bubble size represents the number of titles a player has. You can see the three above mentioned players in the top.
Another demixed "source signal" seemed to correlate with players which are good in playing tiebreaks but which are not specifically good in the other three stats. Among the top players of this dimension were Pat Cash and John Fitzgerald. Apparently these players are just good in playing tiebreaks for some other reason than the ability to handle pressure.
For the last demixed signal it was not clear how to interpret it. It could be that this is still a mixed signal. We would need more measures to unravel this further.
Below there is an interactive version of the plot above:
Conclusion
Using Independent Component Analysis it is possible to create a rating which seems to measure the quality of being able to handle pressure better than the Under Pressure Rating©. We say "seems" since we cannot give hard proof of course, but the examples we showed make it reasonable that we found a better "estimator" of this quality.
Furthermore it was interesting to see that as a "by-product" we found some other tennis qualities in the data. It shows the potential of ICA and suggests it could be applied to improve other measures as well.
References
- All data used for these experiments comes from atptour.com
- All python scripts used for this experiment can be found on GitHub
- Skikit Learn FastICA
- ICA on Wikipedia
- In depth article on ICA